Renko Charts Lite 1.2.2
Continue to app
Free Version
Publisher Description
The only Renko charting app on the store! It uses YahooFinance data feed as a source. So if a stock is listed in YahooFinance, you can quickly and easily see its daily, weekly, or monthly Renko chart.
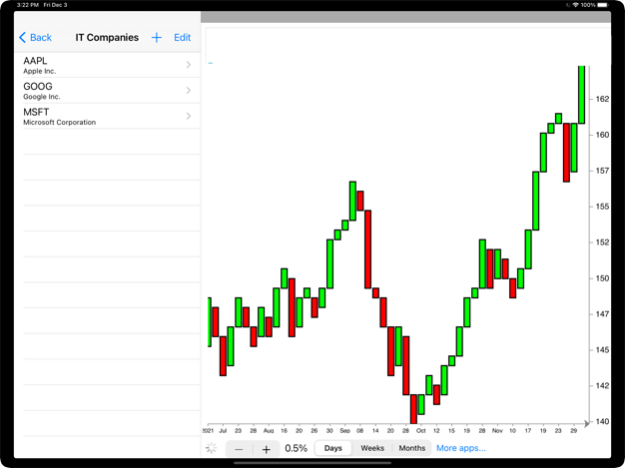
Renko charts are price charts with rising and falling diagonal lines of boxes that are either filled or hollow. Renko charts are "time independent" charts that do not have constantly spaced time axes.
The word "Renko" comes from "Renga", the Japanese word for "brick". The filled and hollow squares that make up a Renko chart are often referred to as "bricks." Renko charts were popularized by Steve Nison in his book Beyond Candlesticks.
Renko charts have a pre-determined "Brick Size" that is used to determine when new bricks are added to the chart. If prices move more than the Brick Size above the top (or below the bottom) of the last brick on the chart, a new brick is added in the next chart column. Hollow bricks are added if prices are rising. Black bricks are added if prices are falling. Only one type of brick can be added per time period. Bricks are always with their corners touching and no more than one brick may occupy each chart column.
It's important to note that prices may exceed the top (or bottom) of the current brick. Again, new bricks are only added when prices completely "fill" the brick. For example, for a 5-point chart, if prices rise from 98 to 102, the hollow brick that goes from 95 to 100 is added to the chart BUT the hollow brick that goes from 100 to 105 is NOT DRAWN. The Renko chart will give the impression that prices stopped at 100.
It's also important to remember that Renko charts may not change for several time periods. Prices have to rise or fall "significantly" in order for bricks to be added.
Green bricks are bullish, Red bricks are bearish - that's the simplest interpretation of Renko charts. Renko charts may be most useful in identifying trends and trend direction. Because they screen out moves that are less than the brick size, trends are much easier to spot and follow. In order to avoid whiplash periods, some people wait until 2 or 3 bricks appear in a new direction before taking a position.
In the app size of the brick is defined by close price percentage.
Dec 5, 2021
Version 1.2.2
YahooFinance symbols autosuggest module is dead. It replaced with custom one.
About Renko Charts Lite
Renko Charts Lite is a free app for iOS published in the Accounting & Finance list of apps, part of Business.
The company that develops Renko Charts Lite is IGOR VLASOV. The latest version released by its developer is 1.2.2.
To install Renko Charts Lite on your iOS device, just click the green Continue To App button above to start the installation process. The app is listed on our website since 2021-12-05 and was downloaded 2 times. We have already checked if the download link is safe, however for your own protection we recommend that you scan the downloaded app with your antivirus. Your antivirus may detect the Renko Charts Lite as malware if the download link is broken.
How to install Renko Charts Lite on your iOS device:
- Click on the Continue To App button on our website. This will redirect you to the App Store.
- Once the Renko Charts Lite is shown in the iTunes listing of your iOS device, you can start its download and installation. Tap on the GET button to the right of the app to start downloading it.
- If you are not logged-in the iOS appstore app, you'll be prompted for your your Apple ID and/or password.
- After Renko Charts Lite is downloaded, you'll see an INSTALL button to the right. Tap on it to start the actual installation of the iOS app.
- Once installation is finished you can tap on the OPEN button to start it. Its icon will also be added to your device home screen.
